
Read the first chapter
The whole of chapter one, free. About 9 min. Turn the pages with the arrows, your keyboard, or a swipe.
Chapter 1
The Map That Made Empires
The Lines That Arrived Before the Empire
In 1492, Christopher Columbus carried a map made by the German cartographer Henricus Martellus. It showed Asia stretched far to the east, making the Atlantic seem narrower than it was. Columbus did not merely sail across an unknown ocean; he sailed inside a mistaken picture of the world.
That error mattered because maps do more than describe places. They make decisions about what counts as a coast, a border, a possession, or an empty space. Once a distant shore has been drawn on European paper, it becomes easier to discuss, measure, divide, tax, defend, and claim.
The story of empire is therefore also a story of surfaces covered with ink. A line on a map could follow a river, ignore a language, cut through a grazing route, or turn a lived homeland into a colored section of someone else’s atlas. The map did not always create power by itself, but it gave power a clean shape.
When did a picture of the world become an instrument for owning it?
From Sailors’ Sketches to Instruments of Rule
Early maps were rarely complete pictures of the earth. They were working documents assembled from travelers’ reports, astronomical observations, inherited myths, and practical knowledge. A portolan chart might show Mediterranean coastlines with remarkable care while leaving inland regions almost blank. Its purpose was not to represent every feature of the world. It was to help a particular person move through a particular space.
That changed as European states expanded their reach across oceans. Navigation demanded better measurements, but conquest demanded something more: a way to convert unfamiliar places into manageable information. Surveyors recorded coastlines, rivers, elevations, harbors, roads, settlements, and resources. Their observations could then be transferred to charts that circulated among monarchs, merchants, military officers, and investors.
The Mercator projection, published by Gerardus Mercator in 1569, illustrates the problem neatly. It was designed to help sailors plot a constant compass bearing as a straight line. For navigation, that was useful. For comparing the size of continents, it was badly misleading: regions near the poles appeared much larger than they really were. Greenland, for example, looked roughly comparable to Africa on many familiar versions of the map, although Africa is vastly larger.
A map can be accurate for one purpose and deceptive for another.
That distinction became politically important. A projection that helped ships cross an ocean also trained generations of viewers to see northern Europe and its colonial territories as visually dominant. The page was not neutral space. It arranged importance through size, position, color, and detail.
European mapmakers also inherited older habits from classical geography. Ptolemy, the second-century geographer in Alexandria, had organized the known world through coordinates of latitude and longitude. His work was rediscovered and printed in Europe centuries later, just as oceanic exploration was accelerating. The grid gave distant places a common language. A coastline in Africa and a harbor in Asia could be placed within the same system, compared, copied, and transferred between documents.
That common language was powerful because it seemed impersonal. A claim written in a royal charter could sound uncertain or ceremonial. A surveyed boundary, by contrast, appeared technical. The map made authority look like measurement.
The Cartographic Claim Model
The Cartographic Claim Model describes how a place can move through four related stages: it is first made visible, then made legible, then made divisible, and finally made governable. These stages did not always occur in a strict sequence, and local people often resisted them. But together they explain why mapping became so central to imperial expansion.
To make a place visible was to bring it into the records of a distant power. European maps often treated lands as newly “discovered” even when they were inhabited, named, farmed, traded across, and carefully understood by their own communities. The word discovery described the arrival of European knowledge, not the existence of the place itself.
Legibility came next. Surveyors translated local knowledge into categories that officials could use: population, land type, crop, road, port, mineral deposit, or administrative district. A forest became timber. A river became a transport route or a boundary. A settlement became a point on a register.
Divisibility turned continuous landscapes into separate units. Lines could distinguish one district from another, or one claimed territory from the next. The line might follow a mountain range, but it could also be drawn across a plain with no visible marker at all. Once printed and repeated, the boundary acquired an authority that the landscape itself did not possess.
Governability was the final transformation. Maps allowed officials to plan roads, assign taxes, station troops, distribute land titles, and enforce laws. A territory that had once been known through relationships - seasonal movement, kinship, trade, and local custom - could now be administered as an area.
The surprising point is that mapping often preceded effective control. A state could color a region on a map long before it had soldiers, roads, or officials there.
This matters because imperial power did not begin only when an army arrived. It could begin when a distant government claimed the right to describe a place, even if its practical reach remained thin. The map was an early announcement that someone else intended to decide what the land meant.
In the late nineteenth century, European powers used this logic with particular intensity in Africa. The Berlin Conference of 1884-1885 did not draw every modern African border in a single meeting, but it established rules by which European powers recognized one another’s claims. European governments negotiated over territories whose borders, political systems, and names were often poorly understood by the negotiators themselves. The map became a negotiating table on which African societies were treated as territories available for allocation.
The Blank Space That Was Never Empty
One of the most consequential features of imperial maps was the blank space. Unmapped regions were often shown as empty, even when they contained villages, paths, fields, sacred places, and detailed systems of local knowledge.
Blankness was not the absence of information. It was the absence of information recognized by the mapmaker.
The distinction can be seen in the mapping of North America. Indigenous nations had their own geographic knowledge, including routes, hunting grounds, water sources, seasonal movements, and territorial relationships. European maps frequently reduced this complexity to scattered place-names or broad labels, then represented large areas as available land. The visual effect encouraged the idea that settlement was moving into wilderness rather than into inhabited political worlds.
The same process appeared in Australia, where British maps gradually converted Aboriginal countries into colonial districts. The term terra nullius, meaning “land belonging to no one,” became a legal fiction used to justify British sovereignty, despite the presence of Aboriginal societies with established laws, obligations, and relationships to country.
A map’s silence could therefore function like an argument. If a road, village, or boundary was not shown, officials could treat it as irrelevant. If a community’s name was omitted, later viewers might assume no community had existed there. Erasure did not require destroying every record. Sometimes it required only replacing many local descriptions with one official outline.
There is a further irony. European mapmakers often depended on Indigenous guides, interpreters, pilots, and informants. Their knowledge made exploration possible, yet the final maps frequently credited European surveyors alone. Information was gathered locally and authority was assigned elsewhere.
A map could be built from many voices and still speak in only one.
The Border as a Human Event
The partition of India in 1947 offers one of the clearest examples of a boundary becoming real before people understood its consequences. Cyril Radcliffe, a British lawyer who had never visited India before 1947, was appointed to chair the commissions that would divide Punjab and Bengal between India and Pakistan. He worked under intense time pressure with incomplete information, using maps, census figures, district records, and political demands.
The resulting Radcliffe Line cut through villages, fields, roads, railways, and communities. In some places, people learned that their district had been assigned to a different country only after the boundary was announced. The line did not simply separate two governments. It altered where people could live, worship, travel, farm, and bury their dead.
The violence and displacement that followed Partition had many causes, including political mobilization, fear, collapsing authority, and organized attacks. The border did not create all those forces. But it gave them a new geography. A neighbor could become a foreigner; a road could lead across an international boundary; a town could be classified as belonging to one nation rather than another.
What makes the episode especially revealing is the contrast between the thinness of the line and the weight placed upon it. On paper, the boundary might be no more than a stroke of ink. On the ground, it required checkpoints, documents, patrols, fences, and new legal identities. The map was light; the institutions built around it were not.
The Cartographic Claim Model helps clarify what happened. Communities that had long been visible to one another were made legible through censuses and administrative districts, divided by a political line, and then governed through the new states. The map did not merely record Partition. It helped turn a political decision into a daily reality.
The Map Is Not the Territory, but It Can Still Govern It
The counterintuitive finding is this: maps are often most powerful where they are least accurate. A precise map can guide a traveler, but an imperfect map can still organize an empire if officials, courts, soldiers, and investors act as though it is authoritative.
That changes how we understand cartography. The key question is not only whether a map resembles the land. It is whether institutions treat the map as a rule. A rough boundary, once printed in treaties and copied into administrative records, can outlast the uncertainty that produced it.
Modern states continue to rely on this power. Property maps turn fields into parcels. Census maps turn populations into districts. Resource maps identify places for mines, dams, plantations, or pipelines. Digital maps now update rapidly, but they still depend on choices about names, categories, visibility, and ownership. A road shown prominently becomes easier to find; a community left unlabeled becomes easier to overlook.
The old imperial habit survives in quieter forms: the assumption that land is best understood from above, that local relationships can be translated into administrative units, and that a clean boundary is preferable to a complicated reality. Mapping does not always serve conquest, but conquest has repeatedly used mapping because it makes messy human worlds appear orderly.
Human beings draw lines to make the world manageable. The danger begins when the line’s convenience is mistaken for the land’s truth. A map can reveal rivers and routes, preserve memory, and prevent disputes; it can also turn living places into objects and then persuade everyone that the objects were there all along.
The most enduring empires may not be the ones that colored the greatest area. They may be the ones that taught the world to see territory as something that could be colored, divided, and possessed. And somewhere beneath every official border, the older landscape remains - crossed by paths, languages, rivers, and memories that no map has ever fully contained.
End of chapter one. 39 more chapters and about 66,822 words in the full book.
Swipe or use the arrows to turn the page


What's inside: 40 chapters
- 1. The Map That Made Empires
- 2. When Germs Crossed Oceans
- 3. The Sugar Behind the Chains
- 4. Borders Drawn in a Hurry
- 5. The Invention of Race
- 6. Who Gets Called Civilized?
- 7. The Wealth That Left Home
- 8. The Factory’s Hidden Bill
- 9. The Commons We Sold
- 10. Why Hunger Survives Plenty
- 11. The Debt Trap Across Generations
- 12. The Coup That Protected Profits
- 13. The Dictator’s Useful Friends
- 14. The Arms Race Nobody Wins
- 15. The Borders That Became Battlefields
- 16. The Peace Deal’s Missing Voices
- 17. The Law That Looked Neutral
- 18. The Schoolbook’s Missing Pages
- 19. The News That Sold Fear
- 20. The Rumor That Became Reality
- 21. The Algorithm’s Quiet Bias
- 22. The Platform That Rewards Outrage
- 23. The City Built for Cars
- 24. The Housing Shortage by Design
- 25. The River Downstream Pays
- 26. The Climate Debt Nobody Collects
- 27. The Species We Erased Unnoticed
- 28. The Medicine Priced Out of Reach
- 29. The Care Work We Don’t Count
- 30. The Job That Cannot Say No
- 31. The Tax Haven’s Secret Map
- 32. The Lobbyist’s Invisible Hand
- 33. The Institution That Forgot Its Purpose
- 34. The Metric That Became the Mission
- 35. The Crisis That Made It Worse
- 36. The Reform That Changed Nothing
- 37. The Protest After the Cameras Leave
- 38. The Repair That Starts Locally
- 39. The Future We Keep Rehearsing
- 40. Where the World Can Turn
About this book
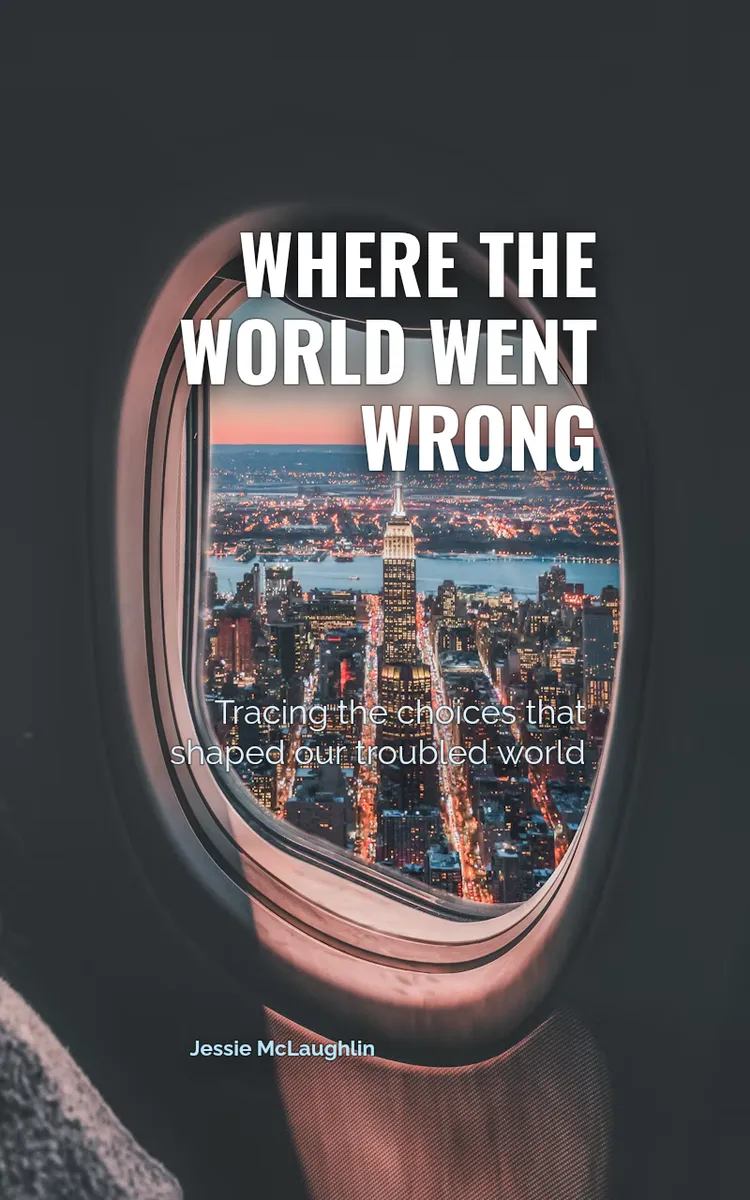
"Where The World Went Wrong" is a nonfiction book by Jessie McLaughlin with 40 chapters and approximately 66,822 words. Historical and social forces behind the world's major problems.
This book was created using Inkfluence AI, an AI-powered book generation platform that helps authors write, design, and publish complete books.
Frequently Asked Questions
What is "Where The World Went Wrong" about?
Historical and social forces behind the world's major problems
How many chapters are in "Where The World Went Wrong"?
The book contains 40 chapters and approximately 66,822 words. Topics covered include The Map That Made Empires, When Germs Crossed Oceans, The Sugar Behind the Chains, Borders Drawn in a Hurry, and more.
Who wrote "Where The World Went Wrong"?
This book was written by Jessie McLaughlin and created using Inkfluence AI, an AI book generation platform that helps authors write, design, and publish books.
Write your own nonfiction book with AI
Describe your idea and Inkfluence writes the whole thing. Free to start.
Start writingCreated with Inkfluence AI


