

Read the first chapter
The whole of chapter one, free. About 10 min. Turn the pages with the arrows, your keyboard, or a swipe.
Chapter 1
Event-Driven Anomalies Primer
What do you do when the tape looks wrong in the first 200 milliseconds - when bids evaporate, prices gap, and your usual “liquid market” assumptions stop working? Event-driven anomalies punish traders who treat volatility as a continuous process. Flash crashes, trading halts, and circuit breakers arrive as discrete shocks, and they change how liquidity forms, how orders get filled, and how far price can run before the market finds a new clearing state.
This chapter gives you a practical way to tell these events apart and translate that difference into tradeable dislocations. After you finish, you’ll be able to (1) classify what you’re seeing - flash crash versus halt versus circuit breaker - using observable microstructure cues, (2) build an Event-Impact Map that links the event to specific order-flow and execution consequences, and (3) set up a repeatable “watch and act” plan for the first minutes after the shock.
You won’t need theory-heavy explanations. You’ll get concrete checks you can run on your own tape, plus a scenario built around Nadia, a 34-year-old prop trader who trades around fast-moving equities and futures and cares about execution quality as much as direction.
Set the context: flash crashes, halts, and circuit breakers create different kinds of dislocations
Flash crashes happen fast and often without a formal interruption. They look like a sudden liquidity failure: bids get pulled, spreads widen, and market orders sweep through thin depth until price overshoots the level where buyers would normally step in. There’s no official “stop the market” button; the market keeps trading, but the path becomes irrational because the matching engine runs out of frictionless liquidity.
Halts and circuit breakers do the opposite: they deliberately interrupt trading (halts) or pause the whole market based on broad stress thresholds (circuit breakers). That interruption changes everything that comes next. When trading resumes, you don’t just get “continued normal trading.” You get a reset in queue position, a reshuffling of limit prices, and a fresh burst of marketable orders that stacked while trading was paused.
Traders often lump these events together under “big volatility,” then wonder why their execution model fails. A strategy that works after a flash crash can get chopped up after a halt because the post-resumption microstructure behaves differently. The same goes for circuit breakers: they can create longer-lived dislocations because the market must reopen after a system-wide pause, not merely after a single venue pauses a subset of instruments.
The problem this chapter solves is classification. If you can’t tell which event you’re dealing with, you can’t predict how liquidity will behave, and you can’t size, time, or place orders with confidence. The goal here is simple: map the event to the execution consequences you can observe, then trade the dislocation with rules instead of guesses.
Teach the core concept: build an Event-Impact Map to separate flash crashes, halts, and circuit breakers
Your core tool in this chapter is the Event-Impact Map. It’s a one-page way to connect a specific market event to specific order-flow and execution effects you can plan around. You’ll use it to avoid treating all “bad prints” the same.
Use the map like this: start with what happened, then write the exact mechanisms you expect. For each mechanism, write the observable cue and the trading implication. The differentiator is that you don’t just mark “high volatility.” You mark queue resets, liquidity withdrawal patterns, and how price discovery restarts.
1. Identify the event type from execution cues - Flash crash: you see abrupt downside (or upside) with trading uninterrupted, spreads blow out, and depth thins quickly. You also see rapid mean-reversion attempts but with uneven fills because liquidity returns unevenly. - Halt: you see a clear trading interruption for that instrument/venue, followed by a resumption that often begins with a volatility burst as queued interest re-enters. - Circuit breaker: you see a broader market-wide pause triggered by stress thresholds, then a reopening that pulls in cross-venue interest and forces re-pricing at the reopened state. Expected output: a single label: “flash,” “halt,” or “circuit,” plus the time window you’ll trade.
2. Map “liquidity behavior” to “execution behavior” - Flash crash impacts liquidity locally and fast: market makers may widen or pull quotes, and limit depth gets consumed. - Halt and circuit breaker impacts liquidity structurally: the market resets, and the book rebuilds from resting limits plus fresh orders after the pause. Expected output: two or three bullet mechanisms you can watch in your Level 1/Level 2 feed (spread widening, depth collapse, book rebuild speed).
3. Add “order-flow consequences” specific to the pause or lack of pause - Flash crash: market orders keep hitting while depth disappears; you often get a fast sweep that creates a dislocation, then a partial repair when limit sellers step back in. - Halt: orders stop interacting; participants cancel, reprice, or re-enter. When trading resumes, you often see a burst of marketable flow as traders unwind risk or re-establish positions. - Circuit breaker: the pause compresses a wider set of orders and risk management actions into the reopening. You often see heavier, more synchronized repricing because many participants act at the same time. Expected output: what you think happens to buy/sell aggressor imbalance in the first few minutes after the event.
4. Translate each impact into a trade plan constraint - For flash crashes, you usually plan for fast timing and quick execution: avoid slow limit orders when depth might not refill where you need it. - For halts and circuit breakers, you plan around the reopening burst: use guardrails (price bands, reduced size, pre-defined invalidation) because your first fills may come at reopened prices that “jump” away from your reference level. Expected output: one execution rule and one risk rule tied directly to the event type.
Concrete example for Nadia: she watches equities and futures and trades around event windows using a simple workflow. She records the event label, then she writes two expected cues in her map: “spread widens + depth collapses” for flash; “book rebuild + reopening burst” for halt/circuit. When she sees the cues disagree with the label, she stops trading or changes the order placement style.
Here’s how the map looks in practice - keep it short enough to update fast during live trading:
| Event label | Liquidity impact you expect | Execution consequence you plan for | First observable cue to check | |---|---|---|---| | Flash crash | Depth thins quickly; spreads widen | Marketable orders get filled through poor levels; limit orders may not get hit | Spread jumps within seconds; bid/ask depth collapses | | Halt | Book pauses; order interaction stops | Queues reset; first post-resume prints can gap | Trading timestamp shows interruption; first prints show burst volatility | | Circuit breaker | Market-wide pause; repricing syncs | Reopening creates large dislocation; fills cluster around reopen | Broad market pause indicator; reopen prints cluster and then disperse |
Putting it into practice: Nadia’s Event-Impact Map workflow on a real reopening window
Nadia doesn’t start with direction. She starts with classification and execution constraints. When she sees a sudden move, she pulls three things immediately: the event timing (did trading stop?), the book behavior (did depth collapse without a pause?), and the price path (did it gap at a boundary or run continuously?).
Scenario: an equity index future enters a violent selloff. Nadia sees prices drop sharply, spreads widen, and then she gets a “trading pause” indicator on her feed. She suspects either a halt in the instrument or a circuit breaker at the market level. She wants to decide what to do in the first 2 minutes after reopening without getting trapped by the reopening burst.
1. Stamp the event boundary - She records the exact pause start and resume time from her data feed. - Expected outcome: if trading truly stopped for the instrument, she labels “halt”; if the pause was system-wide and her cross-venue symbols show the same boundary, she labels “circuit.”
2. Build the Event-Impact Map in 30 seconds - She writes the label: “halt” or “circuit.” - She adds two liquidity expectations: - Halt: “book rebuild from resting limits + new orders; spread starts wide then compresses.” - Circuit: “broad repricing; higher chance of sustained wide spreads after reopen.” - She adds one order-flow expectation: - “First 30-90 seconds show heavy marketable flow as participants re-enter and unwind.”
3. Set execution constraints tied to the label - If she labeled “halt”: - She plans to trade only after she sees the first post-resume book stabilize for a short window (for example, once top-of-book spread stops expanding tick-by-tick). - If she labeled “circuit”: - She expects slower stabilization and uses smaller size until depth rebuilds enough to support the fills she needs. - Expected outcome: she avoids the common trap of chasing the first print.
4. Pick one dislocation trade and define invalidation - Her dislocation target comes from the gap between the last pre-pause price reference and the first few post-resume levels where liquidity appears. - She defines invalidation as a break of the reopened reference level plus a continued aggressor imbalance against her during the stabilization window. - Expected outcome: she captures the mean-reversion or continuation move only while the microstructure supports it.
5. Log what happened and revise the map - After the trade, she writes: “Did spreads compress faster than expected? Did depth rebuild as predicted? Did the aggressor imbalance flip?” - Expected outcome: her next Event-Impact Map becomes sharper, and classification errors drop.
Quick checklist: - Confirm whether trading stopped (halt/circuit) or kept running (flash) by checking the event boundary timestamp. - Measure top-of-book spread behavior: did it explode without a pause (flash) or restart wide after a pause (halt/circuit)? - Watch depth at best bid/ask: did depth collapse quickly (flash) or rebuild in layers after reopening (halt/circuit)? - Decide your timing rule: trade after stabilization for halts; trade smaller and later for circuit reopenings. - Define invalidation tied to reopened reference levels and aggressor imbalance, not just “price moved against me.”
This is where the Event-Impact Map earns its keep: it forces Nadia to treat “reopening” as a distinct microstructure regime. She doesn’t rely on the chart alone. She ties her execution timing to the book mechanics she expects.
What to watch for: mistakes and edge cases that break event-driven trades
Event-driven anomalies reward discipline, and they punish pattern-matching. Here are the most common ways traders get it wrong, plus the fix.
Misclassifying the event boundary If you call a flash crash a halt, you’ll wait for a reopening that never comes. If you call a halt a flash, you’ll keep trading through a pause you can’t see in time, then you’ll chase the first reopen prints with the wrong order type. Do this: verify the pause start/resume timestamps from your feed before you place the first post-shock order. If trading stopped anywhere relevant, treat it as halt/circuit until proven otherwise. Not this: assume “it’s just chaos” when you see a sharp move. The event boundary drives the queue reset.
Overfitting to the first tick after reopening The first print after a halt or circuit breaker often reflects repricing shock, not stable liquidity. If you size for that first tick, you can get clipped by a quick book rebuild that moves your fill away from your expected level. Do this: wait for a stabilization condition you can define: top-of-book spread stops expanding tick-by-tick and depth at best prices stops collapsing further. Then you place your main order. Not this: place the order immediately at resume based only on the first trade price without checking spread and depth behavior.
Ignoring multi-venue and instrument-specific effects Circuit breakers can look “bigger” than they are on your specific instruments, and halts can look “smaller” but still reset your queues in a way that matters for your execution. Traders sometimes watch only one symbol’s chart and miss that the venue you trade may reopen differently than the one you’re monitoring. Do this: check at least two related feeds: the instrument you trade and a closely tied proxy (or your same underlying on a different venue). Confirm that the boundary behavior aligns with your label. Not this: assume all symbols share the same pause mechanism just because the market headlines say “halt” or “circuit.”
A good mental model to keep: flash crashes break liquidity while trading continues; halts and circuit breakers break interaction and then restart price discovery from a reset book. That difference shows up in spread, depth, and how quickly the aggressor imbalance settles. If you can read those three signals fast enough to update your Event-Impact Map, you can trade the dislocation instead of getting dragged through it.
As you move through the rest of the book, you’ll keep using this same habit: classify the event, map the impact to execution, then execute with rules that match the microstructure regime you’re actually in.
End of chapter one. 7 more chapters in the full book.
Swipe or use the arrows to turn the page


What's inside: 8 chapters
- 1. Event-Driven Anomalies Primer
- 2. Reading Order Book During Halts
- 3. Flash Crash Triggers and Signatures
- 4. Circuit Breaker Reopen Trading Plan
- 5. Order Types and Execution Under Stress
- 6. Risk Controls for Event Windows
- 7. Backtesting Halts and Flash Crashes
- 8. Anomaly Monitoring and Post-Event Review
About this book
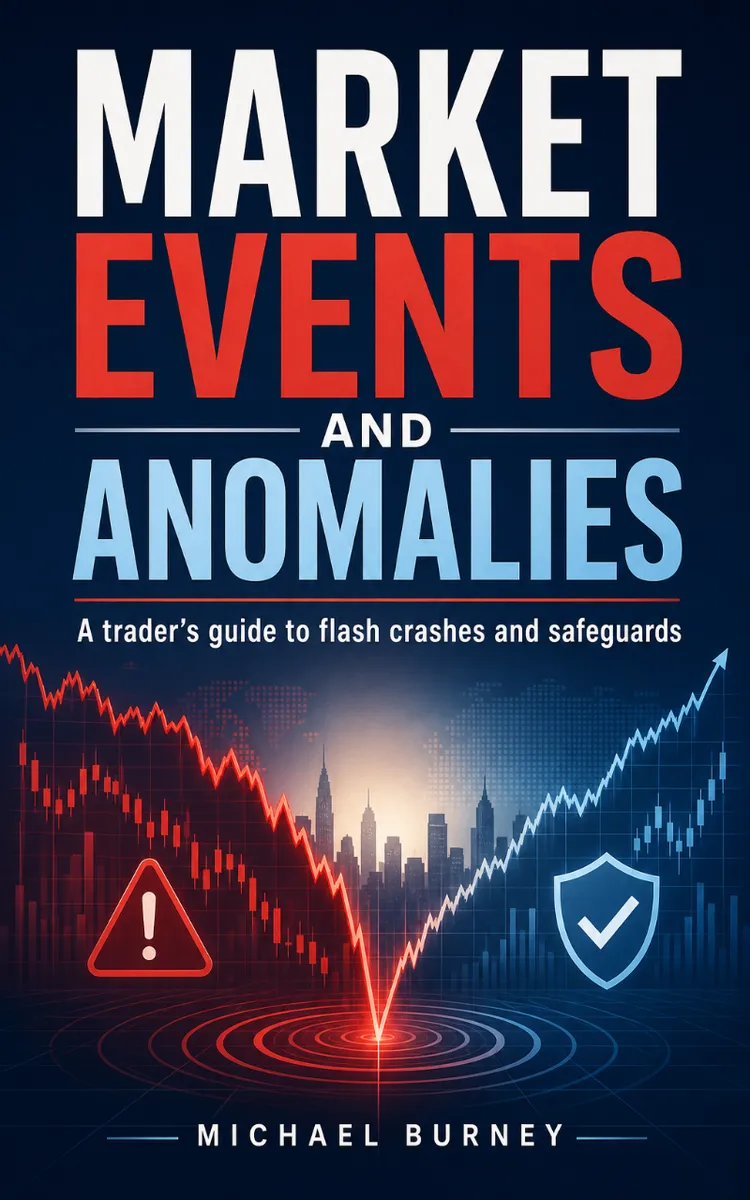
"Market Events And Anomalies" is a finance book by Michael Burney with 8 chapters and approximately 16,621 words. Trading market microstructure around flash crashes, halts, and circuit breakers.
This book was created using Inkfluence AI, an AI-powered book generation platform that helps authors write, design, and publish complete books. It was made with the AI Ebook Generator.
Frequently Asked Questions
What is "Market Events And Anomalies" about?
Trading market microstructure around flash crashes, halts, and circuit breakers
How many chapters are in "Market Events And Anomalies"?
The book contains 8 chapters and approximately 16,621 words. Topics covered include Event-Driven Anomalies Primer, Reading Order Book During Halts, Flash Crash Triggers and Signatures, Circuit Breaker Reopen Trading Plan, and more.
Who wrote "Market Events And Anomalies"?
This book was written by Michael Burney and created using Inkfluence AI, an AI book generation platform that helps authors write, design, and publish books.
How can I create a similar finance book?
You can create your own finance book using Inkfluence AI. Describe your idea, choose your style, and the AI writes the full book for you. It's free to start.
Write your own finance book with AI
Describe your idea and Inkfluence writes the whole thing. Free to start.
Start writingCreated with Inkfluence AI


