

Read the first chapter
The whole of chapter one, free. About 9 min. Turn the pages with the arrows, your keyboard, or a swipe.
Chapter 1
Choosing Your Trading Platform
Why “platform choice” decides your execution quality (and your stress level)
Have you ever clicked “Buy” and felt unsure whether your order will fill at the price you saw? That uncertainty usually comes from the broker and platform, not from you. Platform choice controls how your orders route, how fast they update prices, how reliably the app works during busy market moments, and how much friction you pay every time you trade.
Most retail traders shop for “low fees” and stop there. Then they get surprised by slippage, delayed quotes, missing order fills in the app, or trading tools that look good but don’t match how the broker actually routes orders. This chapter fixes that problem with a practical way to evaluate brokers and platforms using fees, tools, data quality, and reliability for retail execution.
After you finish, you will be able to (1) list the real costs of trading on a platform, (2) test the data and tools before you commit, (3) judge reliability using concrete checks, and (4) score your options with the Platform Fit Scorecard so you can pick a broker that matches how you actually trade.
How to evaluate brokers and platforms with the Platform Fit Scorecard
The Platform Fit Scorecard focuses on the same four areas that show up in real execution: fees, tools, data quality, and reliability. You don’t need a fancy spreadsheet to start, but you do need to measure each option with specific checks. If you can’t test it, you should treat it as “unknown” and score it lower.
Use this scoring approach for each broker/platform you’re considering:
1. Map your real fee load (not the headline rate). Look for commissions (if any), exchange and regulatory fees if they show separately, and any “gotchas” like markups, inactivity fees, or special charges on certain order types. Then estimate your monthly cost using your typical activity. Example: if you place 40 trades per month and you switch from a $0.50/side model to a $0.00 commission model, you might save $40 in commission alone, but only if the platform doesn’t add spreads or other charges you can’t see.
2. Check tools that affect execution, not just charts. Prioritize order tools you actually use: limit orders, stop orders, stop-limit, trailing stops, bracket orders (enter + exit), and whether the platform supports “one-cancels-other” behavior (OCO) if you trade multiple exits. Then confirm how the platform handles fast changes - does it let you edit/cancel quickly, and does it show you the order status in a way you can trust?
3. Test data quality with a repeatable quote and chart check. You want to know whether the platform updates prices fast enough for your trading style and whether the chart you trade from matches the tape (the actual trade prints). Do a simple side-by-side check: open the broker’s chart and compare the last price and candle timing to a second reliable market data source you already trust (for example, a widely used free quote feed). You don’t need perfection; you need consistency and clarity about what you’re seeing.
4. Prove reliability with “failure-mode” testing. Reliability means you can place, cancel, and manage orders during normal market stress. Test: - Does the platform log you out during volatility? - Do order status updates arrive instantly, or do you see delayed “working” states? - Do you still see your open orders when you refresh or switch devices? For each platform, run a short trial window and test the exact actions you plan to do in live trading.
Now score each category. You can use a simple 1-5 scale: - 5 = you can confirm it works and you understand all costs - 3 = it looks fine, but you find gaps or unclear fees - 1-2 = you can’t confirm reliability, tools, or data
When you add up the scores, you’ll stop guessing and start choosing based on evidence.
A concrete score template you can copy Use this table as your working sheet:
| Category | What to check (specific) | Score (1-5) | Notes / proof | |---|---|---:|---| | Fees | Commission + visible exchange/reg fees + spreads you can observe | | | | Tools | Limit/stop/stop-limit/OCO/brackets; cancel/edit speed; order status clarity | | | | Data quality | Last price and candle timing vs a trusted reference; chart type you use | | | | Reliability | Order placement/cancel during busy periods; status updates; app/device sync | | |
The named differentiator: Nadia’s “execution fit” example Nadia, 34, part-time nurse and swing trader, trades a few times per week and holds positions long enough that she cares less about one-second precision and more about order correctness and clean exits. Her platform checks reflect that. She scores tools higher than raw speed: she needs stop-limit and bracket orders to manage entries and exits while she’s at work. She scores data quality by comparing daily candle timing and last price before she places orders. She scores reliability by testing whether her order status stays accurate when she goes from mobile to desktop and back.
That’s the point: the Platform Fit Scorecard doesn’t treat every trader the same. It forces your broker choice to match your execution habits.
Putting it into practice: a realistic evaluation workflow for retail execution
Here’s a workflow you can run over a couple of days without getting lost in settings or marketing screenshots. It uses Nadia’s swing-trader needs as the baseline, but you can adjust the checks to your own order types.
Step-by-step scenario: Nadia tests Broker A vs Broker B Assume Nadia is choosing between two brokers for swing trading. She knows she will use limit entries, stop orders for risk control, and she wants bracket-style exits so she doesn’t have to babysit positions.
1. Write down her exact order types and how often she uses them. Example: “I place limit entries, then I set a stop-limit for downside and a take-profit for upside. I do this on about 8 trades per month.” Expected outcome: you stop evaluating the platform’s charts and start evaluating its order workflow.
2. Collect the fee sheet and total cost estimate. She opens each broker’s pricing page and captures: commission per trade (if any), any platform fees, and whether the broker shows exchange/regulatory fees separately. Expected outcome: she can compute a rough monthly commission cost and knows whether any hidden fees could surprise her.
3. Run a “quote and candle alignment” check for the same symbols. She picks two tickers she trades often and compares: - last price displayed on the platform - how the daily candles form (timing and whether the open/high/low match) She uses a second trusted reference quote source and records any consistent gaps. Expected outcome: she learns whether her charts match reality enough to place limits with confidence.
4. Test orders in paper trading (or small live size if paper isn’t available). She tests these actions in both platforms: place a limit order, edit the limit, cancel it, then place a stop-limit and verify the status changes show as expected. Expected outcome: she confirms she can manage risk without guessing what the platform thinks is happening.
5. Test on the device she actually uses during trading hours. Nadia trades around her schedule. She runs the same order tests on her phone app and then on her desktop (or laptop). Expected outcome: she avoids a common failure mode where the desktop looks fine but the mobile app lags or shows different status wording.
6. Score both platforms using the Platform Fit Scorecard categories. Fees, tools, data quality, reliability each get a 1-5 score based on her proof, not her impression. Expected outcome: one broker rises to the top for her swing-trader execution needs.
Quick checklist - List your order types (limit, stop, stop-limit, bracket/OCO) and how you use them - Calculate your expected monthly fee load from the pricing page - Compare last price and candle timing to a trusted reference for your symbols - Place, edit, cancel, and manage orders in paper mode to verify status clarity - Test the platform on the device you use when you’re busy - Score fees, tools, data quality, and reliability with the Platform Fit Scorecard
If you do these steps, you’ll avoid the “it looked great in a demo” trap and end up with a platform you can execute with while your attention is split.
What to watch for: common mistakes and edge cases that break execution
Even when traders follow the process, a few mistakes keep showing up. These edge cases matter because they directly affect fills, risk control, and your ability to trust what the platform shows you.
Mistake: Choosing the cheapest commission while ignoring total execution cost Low commission can hide a bigger cost in spreads or less favorable order routing. The fix is simple: compare the effective price you get on the same limit orders across brokers during the same market window. Don’t compare only the fee line item. Compare what you actually pay to enter and exit.
Do this: Place the same type of limit order for a liquid symbol on both platforms during normal hours, and record the fill price relative to the displayed bid/ask at the moment you submit.
Not this: Pick the broker with the lowest commission and assume the trade cost will also be lowest.
Mistake: Over-trusting chart visuals without checking data behavior A platform can draw candles nicely while still lagging the last price or misrepresenting fast changes. Even swing traders get burned when a stop triggers at an unexpected level because the “what you see” differs from the “what the market does.”
Do this: Run a quote and candle alignment check for the symbols you trade. Use a second trusted reference and note whether the platform’s last price and daily candle components match consistently.
Not this: Place orders only because the chart “looks right,” especially after market moves or during transitions between trading sessions.
Mistake: Testing tools once, then discovering status delays during real management A platform might let you place an order successfully in a calm window but handle order status updates poorly during volatility. Your risk control depends on knowing whether the stop or bracket legs actually activate.
Do this: In paper trading, test the full lifecycle: submit → amend → cancel → trigger (where possible) and verify the platform updates order status clearly. Then test again on the device you will use.
Not this: Assume order status and cancel behavior will be the same on mobile as it is on desktop, or assume paper trading matches live behavior without checking.
Mistake: Scoring “features” instead of execution workflow Many traders score platforms by how many indicators they have. Nadia’s approach shows the real difference: she scores the workflow that manages risk while she’s at work. If you score features you don’t use, you’ll pick the wrong platform even with a good score.
Do this: Score tools based on the order types you actually place and how confidently you can manage them (edit, cancel, and exit).
Not this: Score based on charting add-ons, watchlist layouts, or automated tools you won’t run.
A solid broker choice ends up feeling boring: you can place orders, track them, and manage exits without second-guessing what the platform is doing. Build that boring certainty with the Platform Fit Scorecard, and you’ll spend less time troubleshooting and more time trading with discipline. As you move forward, you’ll apply the same mindset to order execution rules - because the platform is only one half of the fill quality equation.
End of chapter one. 7 more chapters in the full book.
Swipe or use the arrows to turn the page


What's inside: 8 chapters
- 1. Choosing Your Trading Platform
- 2. Setting Up Orders for Reliability
- 3. Market vs Limit vs Stop Orders
- 4. Designing Bracket Orders and OCO
- 5. Managing Slippage and Spread Costs
- 6. Time-in-Force and Session Planning
- 7. Backtesting Execution with Realistic Assumptions
- 8. Post-Trade Review and Continuous Improvement
About this book
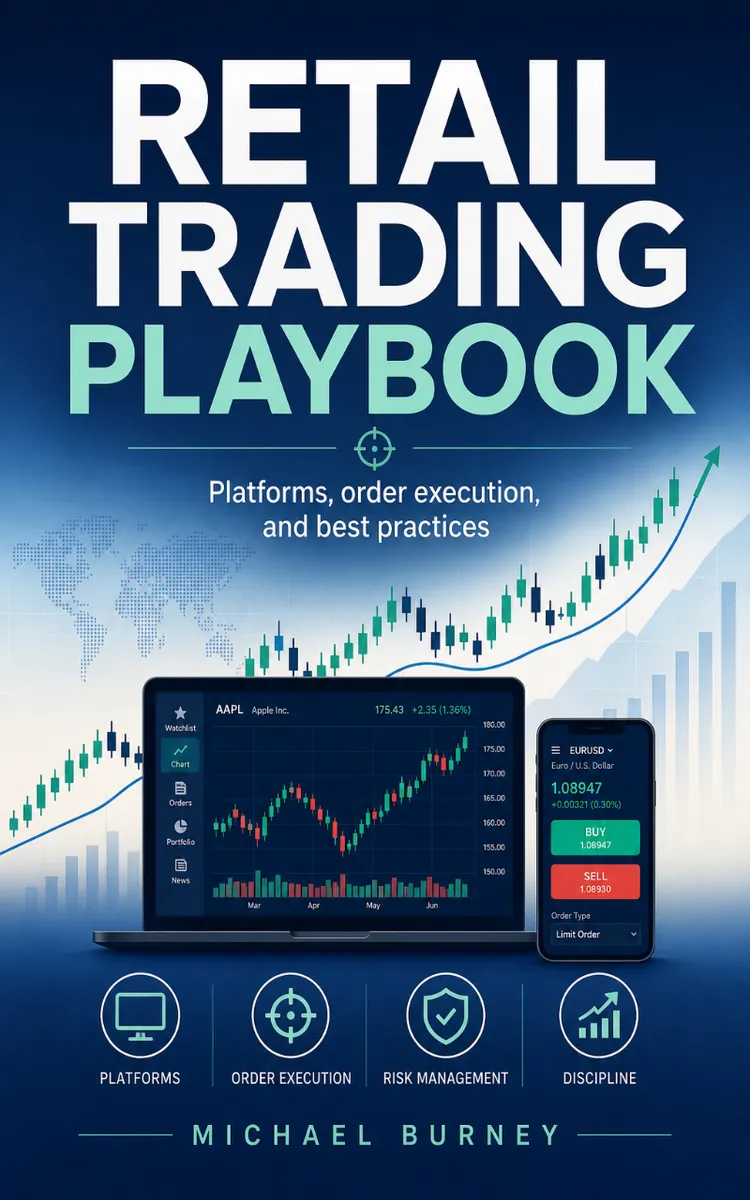
"Retail Trading Playbook" is a finance book by Michael Burney with 8 chapters and approximately 15,485 words. Retail trading guidance on platforms, order execution, and practices.
This book was created using Inkfluence AI, an AI-powered book generation platform that helps authors write, design, and publish complete books. It was made with the AI Ebook Generator.
Frequently Asked Questions
What is "Retail Trading Playbook" about?
Retail trading guidance on platforms, order execution, and practices
How many chapters are in "Retail Trading Playbook"?
The book contains 8 chapters and approximately 15,485 words. Topics covered include Choosing Your Trading Platform, Setting Up Orders for Reliability, Market vs Limit vs Stop Orders, Designing Bracket Orders and OCO, and more.
Who wrote "Retail Trading Playbook"?
This book was written by Michael Burney and created using Inkfluence AI, an AI book generation platform that helps authors write, design, and publish books.
How can I create a similar finance book?
You can create your own finance book using Inkfluence AI. Describe your idea, choose your style, and the AI writes the full book for you. It's free to start.
Write your own finance book with AI
Describe your idea and Inkfluence writes the whole thing. Free to start.
Start writingCreated with Inkfluence AI


