

Read the first chapter
The whole of chapter one, free. About 11 min. Turn the pages with the arrows, your keyboard, or a swipe.
Chapter 1
Market Abuse Types and Red Flags
Have you ever watched a stock price jump and then noticed the trades underneath looked “too coordinated” to be normal? That feeling is exactly what market abuse tools try to convert into evidence: observable trade and order behaviors that map to manipulation and other forms of misconduct.
Traders see the market as flow and liquidity; compliance teams see it as risk. Market surveillance sits in the gap. It needs categories that match how abuse actually shows up in the tape, not just labels from policy. This chapter gives you a practical way to recognize the main abuse types and the red flags that often come right before enforcement actions - so you can spot issues early, document what you saw, and act without guessing.
By the end, you will be able to use the Abuse Taxonomy Map to sort what you observe into the right abuse category, then translate that into concrete checks: what to pull, what patterns to look for, and how to avoid chasing noise. You will also walk through a realistic equities scenario using Leila’s trading and surveillance context, so the steps feel like work you could run tomorrow, not theory you could debate.
Why This Matters: categories and red flags that connect to real enforcement work
Regulators and exchanges do not enforce “bad intent” they cannot prove. They enforce conduct that produces a market impact inconsistent with fair trading, and they build that case from patterns in orders, executions, and communications. The problem is that many abuse patterns share surface similarities. A sharp price move can come from real news, broad sentiment shifts, or a liquidity event. A campaign of orders can look like aggressive trading to one reader and manipulation to another.
That is why categories matter. If you can name the abuse pattern you suspect using a consistent taxonomy, you stop mixing unrelated behaviors and you start building a tighter evidentiary thread. For traders, that means you can distinguish “I traded hard” from “my trading resembles layering” and adjust fast. For compliance and analysts, it means you can prioritize alerts that actually line up with conduct theories and reduce false positives.
This chapter’s topic - core manipulation and abuse categories and observable behaviors that often precede enforcement actions - solves a specific operational gap: turning vague alert descriptions into concrete trade-level evidence. You will learn how to map behaviors like spoofing, layering, wash trading, momentum ignition, and misleading conduct into a structured view you can use across venues and products. You will also learn what to check first when you get a suspicious pattern: order placement timing, order-to-trade ratios, price/size relationships, and whether the behavior repeats around key moments like auction opens or headline windows.
The practical payoff lands in two places. First, you reduce “wait and hope” compliance work: you move from receiving a vague alert to running a defined set of checks. Second, you help traders avoid accidental misconduct: when their own order logic creates a pattern that matches an abuse category, they can fix the behavior before it becomes a case.
How It Works: the Abuse Taxonomy Map and the behaviors behind each category
The Abuse Taxonomy Map works like a labeling system for what you see on the screen. You start with behavior - what orders and trades did - and you end with the most likely abuse category. You do not need to prove intent at this stage. You need to identify the conduct pattern strongly enough that an investigator can decide what to test next.
Use the map as a three-part filter: (1) trading mechanics, (2) market impact goal, and (3) behavioral signatures. Below are the core categories that show up most often in surveillance work, along with concrete signatures you can observe in standard order and trade data.
1. Fictitious or deceptive orders (spoofing, layering, and related tactics) Look for orders that enter and cancel rapidly, especially when the trader places multiple price levels around the touch and does not execute those orders. The signature often includes an unusually high cancel rate, short order lifetimes, and a clear attempt to influence the visible order book without taking the other side.
2. Wash trades and matched trading (including self-trades and circular trading) Watch for trades that occur at or near identical prices and sizes where the same participant appears on both sides, or where counterparties repeatedly match each other with no meaningful economic exposure. The signature includes repeated round-trip trading, low net position change, and patterns that look like “turning volume” rather than taking risk.
3. Momentum ignition and disruption (pump-and-dump variants, churn to distort, and similar conduct) This category focuses on creating or amplifying short-term price movement to attract other participants, then exiting. The signature often includes aggressive buying or selling concentrated in short windows, followed by a move that outlasts normal liquidity provision, and a subsequent reduction in exposure after the price runs. In equities, you often see this around thin liquidity periods, corporate event windows, or specific time-of-day liquidity shifts.
4. Misleading conduct (information-related deception and manipulative communications) This category targets false or misleading signals, including coordinated messages, deceptive reporting, or conduct that is designed to make the market believe something that is not true. The signature often shows up as message timing clusters, correlation between communications and trading spikes, and trading patterns that align with the content’s alleged effect. In practice, surveillance pairs chat or public communications evidence with trade/order evidence.
5. Cornering, squeeze, and improper control (especially in derivatives or hard-to-borrow contexts) Here the conduct centers on attempting to control supply or settlement outcomes. The signature includes persistent accumulation of positions in a constrained instrument, unusual borrow or delivery-related behavior, and aggressive enforcement of settlement mechanics around key dates. In many workflows, this category connects to position and reference data, not just intraday order flow.
Now connect this to what you should measure. For each category, you pick a small set of “behavioral measurements” that you can pull quickly and defend in a review.
• For spoofing/layering, measure order lifetime, cancel-to-place ratio, and distance from mid (how far orders sit from the current price). - For wash/matched trading, measure net position change, self-match indicators, and repeat counterparties with tight price clustering. - For momentum ignition, measure trade concentration over time, aggressor side changes, and price impact relative to typical volatility for that instrument during comparable sessions. - For misleading conduct, measure timing alignment between messages and trading bursts, plus how trades behave before and after the communication. - For squeeze/corner, measure position build speed, concentration, and any settlement-driven actions around known dates.
Concrete example: suppose you see a trader place 50 orders across five price levels within two minutes and cancel every one within 10 seconds, then they buy only one small order near the end. That pattern strongly fits the fictitious/deceptive orders category because the trader likely tried to paint liquidity on the book without committing capital at those levels.
Concrete example: suppose you see the same participant trade with the same counterparty repeatedly over a day, always returning to near-zero net position, with trades at stable prices and small incremental changes. That pattern fits wash/matched trading, because the economic outcome does not match a normal directional strategy.
Once you map the behavior to a category, you decide what to test next. The test should answer: “What else would we expect to see if this behavior is real abuse?” That keeps your review from drifting into generic suspicion.
Putting It Into Practice: apply the map to Leila’s equities alert and document the evidence
Leila, 34, trades equities at a prop firm. Her desk runs fast execution strategies and she takes pride in clean order logic. One morning, she gets an internal compliance query: an alert flagged a set of orders in a mid-cap name around the first 30 minutes of trading. The internal note says, “Possible layering/spoofing.” Leila wants to know whether her strategy logic explains it, or whether it created a red flag she needs to fix.
Assumptions you can use in your own workflow: you have access to order-level data (place time, cancel time, price, size, side), trade prints (execution time, price, size), and basic participant identifiers for the trader and any linked accounts. You also know the instrument’s typical liquidity profile for the day.
Follow these steps to apply the Abuse Taxonomy Map and produce a defensible output.
1. Set the time window and anchor point (first suspect moment) Pull all orders for Leila’s identifiers from 09:30:00 to 10:00:00 local exchange time. Then locate the alert’s “anchor” event: the first order placement that triggered the alert or the first large cancellation burst. Expected outcome: You isolate the behavior cluster instead of reviewing the entire day.
2. Compute order behavior signatures for the suspect window For that window, calculate: - total orders placed - total orders canceled - average order lifetime (cancel time minus place time) - ratio of canceled size to placed size - distribution of order prices relative to mid (e.g., within 1 tick, 1-3 ticks, >3 ticks) Expected outcome: You confirm whether the behavior looks like “place and vanish” across book levels.
3. Check for execution mismatch (placed liquidity vs executed liquidity) Compare the orders that were canceled against the trades that actually executed. Ask: did Leila’s strategy place meaningful size at multiple price levels and then execute very little of it? Or did executions occur consistently at the same levels where orders sat? Expected outcome: A spoofing/layering pattern shows high placed size with low execution at those levels.
4. Map the behavior into a category using the Abuse Taxonomy Map If you see rapid cancellations across multiple price levels near the touch, map it to fictitious or deceptive orders. If you see repeated self-matching with no net exposure, map it to wash/matched trading. Expected outcome: You stop at one primary category before exploring others.
5. Validate with “does it match normal strategy behavior?” Pull the same metrics for two control windows: - the prior day same session window - a later hour in the same day with similar liquidity Then compare order lifetime and cancel ratios. Expected outcome: If the pattern spikes only around the suspect window, it signals abnormal behavior. If it repeats consistently, it may reflect expected strategy mechanics that need a tuning change.
6. Document what you found in plain evidence terms Write a short evidence summary your compliance team can use: “From 09:38:10-09:39:40, 42 limit orders at prices within 1-3 ticks of mid were placed and canceled; average lifetime 6.5 seconds; executed size represented 8% of placed size in those levels.” Expected outcome: You create a record that supports either a mitigation plan or a deeper investigation.
Now add the operational “Quick checklist” Leila’s team can run every time they get an order-flow alert.
Quick checklist - Pull the suspect window plus two control windows (prior day and later hour). - Measure order lifetime and cancel-to-place ratio in the suspect window. - Compare placed size at each book level to executed size at those same levels. - Check whether the pattern concentrates near the touch (ticks from mid) or far away. - Map to one primary category on the Abuse Taxonomy Map before running deeper tests. - Write evidence in order-level numbers you can reproduce.
After Leila runs the checks, she sees something specific: rapid cancellations clustered across three price levels at the touch, with almost no execution on those levels. Her execution prints occur only after the cancellations stop, suggesting her orders were influencing the visible book before she committed. That maps cleanly to fictitious or deceptive orders. The next step is not “argue intent.” The next step is “change behavior and prove it with new runs.”
What to Watch For: common mistakes and edge cases that derail real detection work
Most teams lose time in two ways: they chase the wrong category, or they treat a red flag as proof. These mistakes show up quickly in day-to-day surveillance reviews.
Mistake: Treating any price move as momentum ignition A news headline, index rebalancing, or general risk-on tape can produce a sharp move without any manipulation. If you only look at price direction and ignore order mechanics, you will misclassify normal aggression as momentum ignition. Do this: Require a trading signature first - trade concentration in a short window, aggressor-side dominance, and a follow-through pattern that aligns with the proposed conduct. Then check whether the behavior deviates from the instrument’s typical session pattern. Not this: Start with “price went up fast, so someone pumped it” and only later check order flow.
Mistake: Over-labeling legitimate market making as layering Some strategies place and cancel orders to manage inventory and spread, especially in tight markets. That can look like layering if you use only cancel rate. Do this: Compare the suspect window to control windows. If the cancel behavior matches the strategy’s normal rhythm and executions occur in a consistent, economically sensible way, treat it as a strategy mechanics issue, not a likely deception case. Not this: Flag “high cancels” as spoofing without checking whether the cancellations cluster across multiple levels in a way that creates a visible liquidity illusion and then fails to execute.
Mistake: Ignoring wash trade indicators because counterparties look different Wash trades sometimes use multiple linked accounts, different routing destinations, or internal crossing that breaks the simplest “same counterparty” assumption. If you only check one matching field, you miss the pattern. Do this: Use participant identifiers and any available self-match flags. Also check net position change around the trades and look for tight price clustering with return-to-flat behavior. Not this: Conclude “not wash trading” because the counterparty label differs in one data field.
Edge case to keep in mind: auction and opening/closing dynamics. Many instruments show elevated order activity around auctions, and liquidity naturally shifts. Your red-flag metrics must account for that baseline. That is why the control windows matter. Without them, you will either flood investigations with noise or miss a real pattern that only appears briefly.
As Leila adjusted her order logic, she targeted the specific behavioral signature: she reduced rapid multi-level placements near the touch and changed her cancellation discipline so executions aligned with her intended risk. Compliance later reran the same measurements on a new window and the cancel-to-place ratio fell to levels consistent with her normal session behavior. The alert system stopped firing, not because the market “became calmer,” but because the observable conduct stopped matching the abuse category’s signature.
That is the takeaway you should carry forward: market abuse detection works when you tie categories to measurable behaviors, then test whether the behavior repeats outside the suspect window. Keep your taxonomy tight, your evidence concrete, and your checks reproducible - and you will spend less time debating and more time correcting.
End of chapter one. 7 more chapters in the full book.
Swipe or use the arrows to turn the page


What's inside: 8 chapters
- 1. Market Abuse Types and Red Flags
- 2. Surveillance Workflow and Case Triage
- 3. Order Book Microstructure Indicators
- 4. Trade-Based Manipulation Detection Rules
- 5. Cross-Venue and Cross-Asset Correlation
- 6. Text and Communication Surveillance for Market Integrity
- 7. Building Explainable Alert Scoring Models
- 8. Investigation Playbooks and Integrity Reporting
About this book
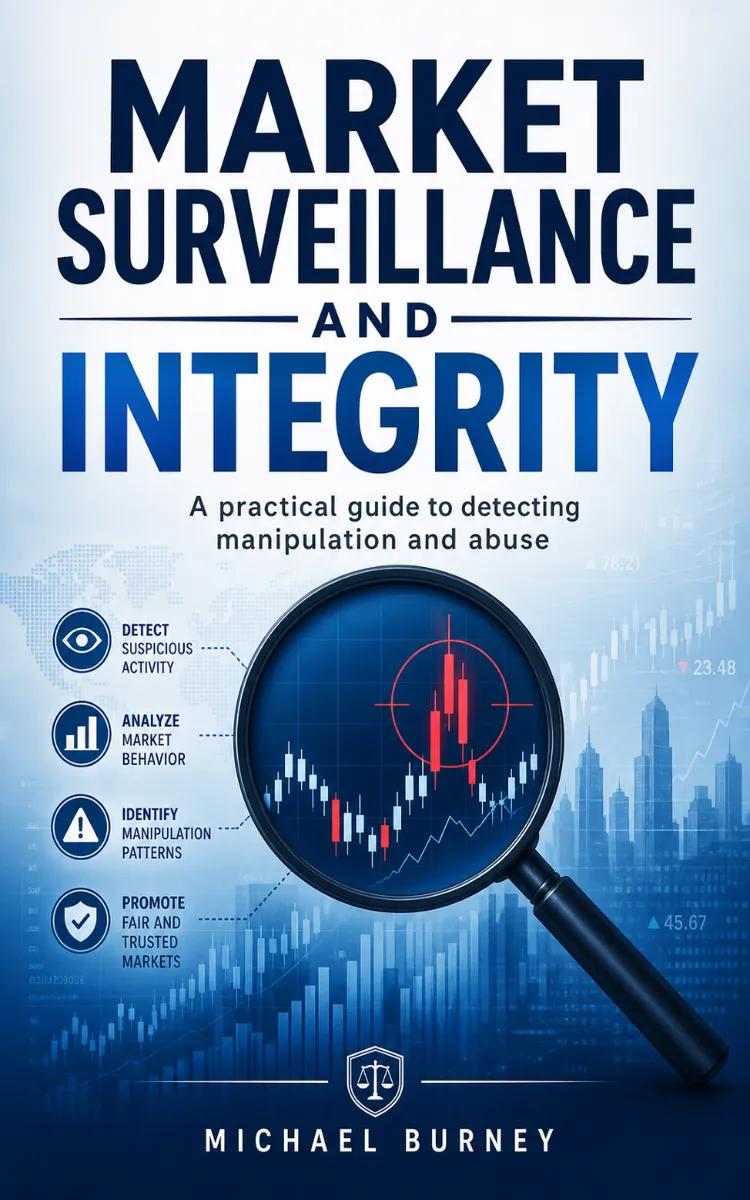
"Market Surveillance And Integrity" is a finance book by Michael Burney with 8 chapters and approximately 17,753 words. Trading market surveillance methods for detecting manipulation and abuse.
This book was created using Inkfluence AI, an AI-powered book generation platform that helps authors write, design, and publish complete books. It was made with the AI Ebook Generator.
Frequently Asked Questions
What is "Market Surveillance And Integrity" about?
Trading market surveillance methods for detecting manipulation and abuse
How many chapters are in "Market Surveillance And Integrity"?
The book contains 8 chapters and approximately 17,753 words. Topics covered include Market Abuse Types and Red Flags, Surveillance Workflow and Case Triage, Order Book Microstructure Indicators, Trade-Based Manipulation Detection Rules, and more.
Who wrote "Market Surveillance And Integrity"?
This book was written by Michael Burney and created using Inkfluence AI, an AI book generation platform that helps authors write, design, and publish books.
How can I create a similar finance book?
You can create your own finance book using Inkfluence AI. Describe your idea, choose your style, and the AI writes the full book for you. It's free to start.
Write your own finance book with AI
Describe your idea and Inkfluence writes the whole thing. Free to start.
Start writingCreated with Inkfluence AI


