
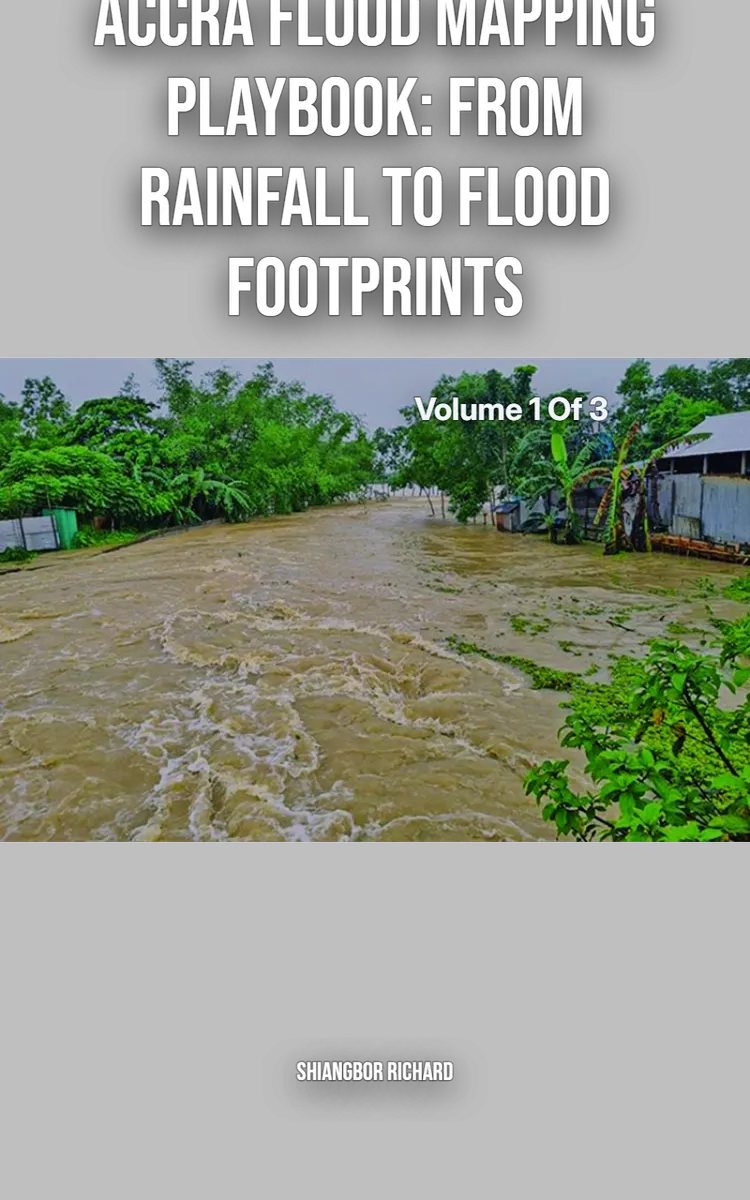
Accra Flood Mapping Playbook: From Rainfall to Flood Footprints
Created with Inkfluence AI
🔀 Remixed from Ghana Flood Drainage Solution Package
Learn how to think like a flood mapper by tracking water accumulation, movement, and blockages during the specific rainy timing that matters most.
Table of Contents
- 1. Why Accra Floods Don’t Behave Like Maps
- 2. The Flood Timeline: Minutes, Hours, and Stays
- 3. Where Water Builds Up: Low Ground and Micro-Sinks
- 4. How Water Moves: Flow Paths, Edges, and Barriers
- 5. The Blockage Problem: Channels, Narrowings, and Debris
- 6. Flood Mapping Lite: A Simple Field-to-Map Workflow
- 7. Your First Flood-Prone Zone Report (Practice)
Preview: Why Accra Floods Don’t Behave Like Maps
A short excerpt from “Why Accra Floods Don’t Behave Like Maps”. The full book contains 7 chapters and 10,653 words.
Why Accra Floods Don’t Behave Like Maps
If you have ever driven through Accra during a heavy downpour, you already know this: the rain can turn “normal” roads into shallow rivers within minutes. And then, instead of disappearing quickly like many people expect, the water may linger. Sometimes it drains slowly. Sometimes it pools in the same low spots again and again. Sometimes it finds a new route after the first one gets blocked.
This is why flood mapping in Accra is not the same thing as “normal planning.” A planning map often answers a simple question: Where is everything? A flood map has to answer a harder one: What happens to water when the rain hits, how fast does it move, where does it get stuck, and what changes as the storm builds?
In this series, we will keep returning to that difference. Volume 1 sets the foundation. By the time you finish it, you should be able to look at an area and say, “I understand the likely timing, pathways, and bottlenecks.” Not because you memorized equations, but because you know how urban water behaves in Accra.
Maps Are Still Useful - They Just Answer the Wrong Question at First
Let’s start with something reassuring. Maps are not useless. They tell you where roads, drains, creeks, and low ground are. That matters.
But a standard map does not automatically tell you:
How quickly water appears when rainfall intensity is high.
What fills first (low ground, channel bottoms, roadside gutters).
How flow changes when water backs up and spreads sideways.
Where the real bottlenecks are (narrow culverts, blocked channels, constricted crossings).
How long water stays after the peak rain.
In Accra, those missing pieces are exactly where the problem is.
Everyday Accra Scenarios: Water Moves, Then Waits
To make this real, let’s walk through a few familiar situations. You might recognize them even if you have never called them “flood mechanisms.”
Scenario 1: The Road That Becomes a River
Picture a typical arterial road during a strong storm. At first, you might see water only on the surface. Then, within minutes, the water deepens and starts moving faster. The road acts like a channel.
Now here is the key part: after the peak rain passes, the water does not always vanish. Instead, it can slow down and linger because the downstream drainage path is not ready, not wide enough, or partially blocked. So the road stops being a “river” and becomes a “pond.”
This is a pathway plus a bottleneck story:
Pathway: water follows the lowest connected routes across the road network.
Bottleneck: the exit point (a culvert, a drain outlet, a crossing) limits how fast water can leave.
Scenario 2: Low Ground Fills First, Then Spreads
In many neighborhoods, the first water you notice is not always at the “worst” flood point people talk about. Often, water collects in the lowest areas first. Once those spots fill, the water begins to spread outward.
That means flood-prone areas are not only about where the worst pool ends up. They are also about where water starts spreading from. If you only map the final flooded area, you miss the chain reaction that leads there.
Scenario 3: Drainage Channels Get Narrower Than You Think
Accra’s drainage system is a mix of planned channels, roadside gutters, natural swales, and man-made crossings. During heavy rain, any narrowing becomes a major issue.
Common real-world narrowing includes:
debris and litter reducing effective channel width
sediment buildup raising the channel bed
blocked inlets where water should enter culverts
constricted culvert sections under roads
When the effective capacity drops, water backs up. And once water backs up, it starts taking alternative routes across the surface, which can create flooding in places that look “uphill” on a basic map.
Scenario 4: The “Stays” Problem After the Rain
Many people judge drainage by how quickly water disappears. In flood mapping, that timing is not a side detail. It tells you whether water is leaving freely or trapped.
Water can linger because:
the downstream outlet is overwhelmed
water is stored in low basins and cannot drain fast enough
overflow paths are limited or blocked
high tide or wet conditions in receiving areas slow outflow (where relevant)
So the “stays” phase is part of the story. A flood map that only captures peak extent without considering duration can lead to the wrong priorities.
Timing, Pathways, and Bottlenecks: The Core of This Series
Most flood problems in Accra are not caused by one single thing. They come from combinations: low ground fills first, drainage gets narrowed, rainfall hits faster than the system can release it, and a bottleneck controls how far water spreads.
To keep our approach clear, we will use three foundation ideas throughout Volume 1 and into the next volumes:
...
About this book
"Accra Flood Mapping Playbook: From Rainfall to Flood Footprints" is a how-to guide book by shiangbor richard with 7 chapters and approximately 10,653 words. Learn how to think like a flood mapper by tracking water accumulation, movement, and blockages during the specific rainy timing that matters most..
This book was created using Inkfluence AI, an AI-powered book generation platform that helps authors write, design, and publish complete books. It was made with the AI Ebook Generator.
Frequently Asked Questions
What is "Accra Flood Mapping Playbook: From Rainfall to Flood Footprints" about?
Learn how to think like a flood mapper by tracking water accumulation, movement, and blockages during the specific rainy timing that matters most.
How many chapters are in "Accra Flood Mapping Playbook: From Rainfall to Flood Footprints"?
The book contains 7 chapters and approximately 10,653 words. Topics covered include Why Accra Floods Don’t Behave Like Maps, The Flood Timeline: Minutes, Hours, and Stays, Where Water Builds Up: Low Ground and Micro-Sinks, How Water Moves: Flow Paths, Edges, and Barriers, and more.
Who wrote "Accra Flood Mapping Playbook: From Rainfall to Flood Footprints"?
This book was written by shiangbor richard and created using Inkfluence AI, an AI book generation platform that helps authors write, design, and publish books.
How can I create a similar how-to guide book?
You can create your own how-to guide book using Inkfluence AI. Describe your idea, choose your style, and the AI writes the full book for you. It's free to start.
Write your own how-to guide book with AI
Describe your idea and Inkfluence writes the whole thing. Free to start.
Start writingCreated with Inkfluence AI


